Aligning Partner Compensation to Actual Contribution
As new compensation allocations take effect in the new year, firms should ensure they are paying partners in accordance with their true economic contributions.
October 30, 2017 at 01:30 PM
7 minute read
 Shutterstock
As we approach year-end and another compensation cycle, it's appropriate to step back and think about how individual partner compensation is determined. At many firms, there is a natural tendency to base this year's comp on last year's, plus or minus an adjustment based largely on the firm's financial performance. This is entirely understandable. However, there's an inherent danger: what if a partner's annual increases have been slightly above those justified by the economics of their practice so that the compounded effect is to have compensation significantly above that warranted by contribution? Or if a valuable partner's compensation has grown year-by-year at a rate below that of the increase in their economic contribution so that now there's a sizeable gap that makes them a flight risk?
For these reasons, it behooves compensation committees to take stock of partners' economic contributions relative to their compensation now before the compensation process gets into high gear. This is not to say that compensation committees should link a partner's compensation exclusively to economic contribution. There are multifarious factors beyond the profitability of a partner's practice that come into play in determining a partner's compensation. Nonetheless, profitability must play an important role if a firm is to be fair to partners and to not defections of high-performing partners to rivals prepared to pay closer to the economic contribution of a practice.
The challenge is in how to do so. Simple profitability measures that work in other businesses don't work in law for two reasons: partner compensation can be viewed as both profit and expense; partner roles can be viewed as both to originate (i.e. be the salesforce) and to execute (i.e. be the production group).
There is a way to cut through these dualities. It is to look at the “balance of trade” in margin, that is to look at contributions to firm profits from each partner's practice relative to allocations from firm profits through compensation. Views of this balance of trade from origination and execution perspectives can be overlaid to allow leaders to assess comprehensively the compensation of individual partners.
Balance of trade in margin
Law firms all follow the same financial model: partners generate margin from their practices; the total margin generated by all partners is used first to cover overhead costs with the remainder becoming the firm profit pool; this pool is ultimately distributed back to partners as compensation.
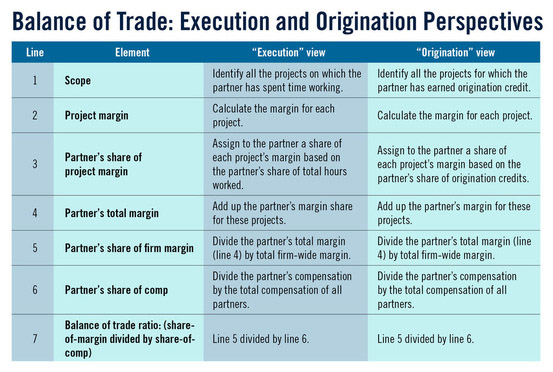
For every partner at a firm, one can look at the margin that partner's practice generates as a percentage of the total margin generated by all partners; similarly, one can look at a partner's compensation as a percentage of the total compensation of all partners. These percentages contrast the partner's relative contribution to, and allocation from, the firm profit pool. The ratio of the two, i.e. the ratio of share-of-margin to share-of-comp, can be thought of as a balance of trade in margin: for ratios above one, partners are contributing more than they're taking; for ratios below one, they're taking more than they're contributing. The ratio can be looked at from both origination and execution perspectives, see Table 1.
There are some subtleties with the methodology worth noting. One has to do with how contribution is calculated, specifically that it is based on a margin determined as realized revenues net of the direct cost of the lawyers working on the project rather than net of fully-loaded costs. The reason for this is that the partner controls the level of seniority of the professionals deployed on the project, and their time commitment, but does not control support personnel wages, office costs, and firm-wide overhead. Including cost elements beyond a partner's control in a measure for which the partner is considered to be responsible misaligns responsibility and control, a sure way to engender frustration.
Another subtlety is in why the methodology looks at share of margin and share of comp rather than at the absolute dollar amounts of each. This is primarily because looking at aggregate dollar numbers can be misleading (e.g. the contribution number does not reflect all costs) and hard to grasp (aggregate numbers have no context; percentages are more natural). Looking at percentages helps too as they are comparable year-to-year in a way that dollars are not because of inflation, growth in the number of partners, changes in overhead levels, etc.
Lastly, it's worth noting that the methodology can be refined by, for example, excluding the margin contribution and compensation for partners in firm-wide leadership roles, those recently promoted, recent lateral hires, and calls on the profit pool to fund pension plans, etc.

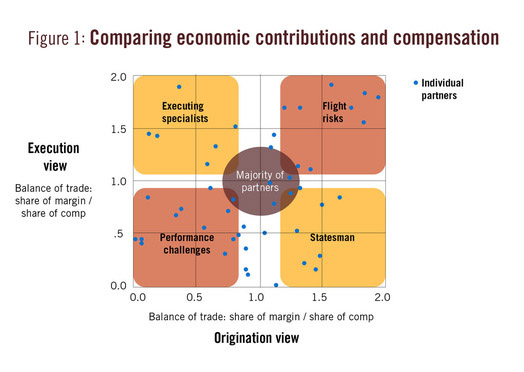
By overlaying the balance of trade of individual partners from origination and execution perspectives on a chart, as shown in Figure 1, compensation committees can get a comprehensive view of how a partner's economic contribution aligns with their compensation. Each point on the chart represents an individual. The majority of partners will cluster near the center of the grid, where the balance of trade in margin on both views is between 0.7 and 1.3. There will also be some natural outliers; for example, partners with primarily execution roles will show in the top left as having a high balance of trade (ratio above one) on the execution (vertical) axis but a low balance of trade (ratio below one) on the origination (horizontal) axis. Similarly, senior statesmen—partners who maintain broad trusted-adviser relationships with clients from whom they source work that they route to others to execute—will show in the bottom right, i.e. with balances of trade that are high from the origination perspective but low from the execution perspective.

The areas that typically require leaders' attention are the top right and bottom left quadrants. The former are partners who are generating significantly more margin than they're taking home in compensation, from both origination and execution perspectives, and are thus high flight risks. The bottom left group has the opposite balance of trade—contributing less than they are taking from both origination and execution perspectives. For both these cases, leaders can use the balance of trade methodology to identify separately the changes in practice economics and compensation that would be required to restore balance. There is, of course, a real-world linkage between these two quadrants: while compensation changes in the lower left quadrant can be especially challenging as there may be highly-respected long-tenured partners in the quadrant. However, it's necessary to address these situations to have the capacity to mitigate the flight risk of high-performance partners in the top right quadrant.
In a legal market increasingly characterized by aggressive competition between law firms for the most commercially-successful partners, getting partner compensation right is profoundly important and arguably the highest-responsibility of any firm's leadership. Being more analytical and more informed can only help, even when it requires rethinking how one looks at the economic fundamentals.
Hugh A. Simons, Ph.D., is an ALM Intelligence Fellow. He is a former senior partner and chief financial officer at The Boston Consulting Group and former chief operating officer at Ropes & Gray. The ALM Intelligence Fellows Program is a collaboration between ALM and leading thought leaders in the legal industry. The program aims to foster the development of data-driven research on key topics related to the business of law.
This content has been archived. It is available through our partners, LexisNexis® and Bloomberg Law.
To view this content, please continue to their sites.
Not a Lexis Subscriber?
Subscribe Now
Not a Bloomberg Law Subscriber?
Subscribe Now
NOT FOR REPRINT
© 2025 ALM Global, LLC, All Rights Reserved. Request academic re-use from www.copyright.com. All other uses, submit a request to [email protected]. For more information visit Asset & Logo Licensing.
You Might Like
View All
Strategic Pricing: Setting the Billable Hour at the Intersection of Psychology, Feedback and Growth


'Rethink Everything' or 'Optimize What's Working'? The Right Law Firm Strategy
7 minute readTrending Stories
Who Got The Work
Michael G. Bongiorno, Andrew Scott Dulberg and Elizabeth E. Driscoll from Wilmer Cutler Pickering Hale and Dorr have stepped in to represent Symbotic Inc., an A.I.-enabled technology platform that focuses on increasing supply chain efficiency, and other defendants in a pending shareholder derivative lawsuit. The case, filed Oct. 2 in Massachusetts District Court by the Brown Law Firm on behalf of Stephen Austen, accuses certain officers and directors of misleading investors in regard to Symbotic's potential for margin growth by failing to disclose that the company was not equipped to timely deploy its systems or manage expenses through project delays. The case, assigned to U.S. District Judge Nathaniel M. Gorton, is 1:24-cv-12522, Austen v. Cohen et al.
Who Got The Work
Edmund Polubinski and Marie Killmond of Davis Polk & Wardwell have entered appearances for data platform software development company MongoDB and other defendants in a pending shareholder derivative lawsuit. The action, filed Oct. 7 in New York Southern District Court by the Brown Law Firm, accuses the company's directors and/or officers of falsely expressing confidence in the company’s restructuring of its sales incentive plan and downplaying the severity of decreases in its upfront commitments. The case is 1:24-cv-07594, Roy v. Ittycheria et al.
Who Got The Work
Amy O. Bruchs and Kurt F. Ellison of Michael Best & Friedrich have entered appearances for Epic Systems Corp. in a pending employment discrimination lawsuit. The suit was filed Sept. 7 in Wisconsin Western District Court by Levine Eisberner LLC and Siri & Glimstad on behalf of a project manager who claims that he was wrongfully terminated after applying for a religious exemption to the defendant's COVID-19 vaccine mandate. The case, assigned to U.S. Magistrate Judge Anita Marie Boor, is 3:24-cv-00630, Secker, Nathan v. Epic Systems Corporation.
Who Got The Work
David X. Sullivan, Thomas J. Finn and Gregory A. Hall from McCarter & English have entered appearances for Sunrun Installation Services in a pending civil rights lawsuit. The complaint was filed Sept. 4 in Connecticut District Court by attorney Robert M. Berke on behalf of former employee George Edward Steins, who was arrested and charged with employing an unregistered home improvement salesperson. The complaint alleges that had Sunrun informed the Connecticut Department of Consumer Protection that the plaintiff's employment had ended in 2017 and that he no longer held Sunrun's home improvement contractor license, he would not have been hit with charges, which were dismissed in May 2024. The case, assigned to U.S. District Judge Jeffrey A. Meyer, is 3:24-cv-01423, Steins v. Sunrun, Inc. et al.
Who Got The Work
Greenberg Traurig shareholder Joshua L. Raskin has entered an appearance for boohoo.com UK Ltd. in a pending patent infringement lawsuit. The suit, filed Sept. 3 in Texas Eastern District Court by Rozier Hardt McDonough on behalf of Alto Dynamics, asserts five patents related to an online shopping platform. The case, assigned to U.S. District Judge Rodney Gilstrap, is 2:24-cv-00719, Alto Dynamics, LLC v. boohoo.com UK Limited.
Featured Firms
Law Offices of Gary Martin Hays & Associates, P.C.
(470) 294-1674
Law Offices of Mark E. Salomone
(857) 444-6468
Smith & Hassler
(713) 739-1250


