What Drives Your Profit Per Equity Partner?
A data driven analysis of the key drivers of profit per equity partner
June 20, 2018 at 10:54 AM
7 minute read
 Editor's Note: this is the third in a three-part series looking at issues related to peer selection. Part I looks at a new approach to selecting peers. Part II presented evidence that peer sets should be updated regularly.
The previous articles discussed a new approach to identifying peers. But we had purposefully ignored Profit per Equity Partner (PPP) as a metric in the peer selection process. However, PPP is an important parameter that is reported widely to gauge the compensation level of an average equity partner.
Let's look into the operating drivers of PPP and translate compensation into factors that a law firm can manage – and then seek to enhance.
Drivers of PPP
Let's start with PPP for a single firm, which is its Net Operating Income divided by the annual average FTE of equity partners. Simply put,
PPP = Net Operating Income / Equity Partner FTE
If we insert Lawyer FTE figure into this equation, we can transform this equation into Profit per Lawyer multiplied by Leverage. And since Profit per Lawyer is Revenue per Lawyer minus Cost per Lawyer, we can arrive at
PPP = {( Revenue Per Lawyer) – (Cost Per Lawyer)} * (Equity Partner Leverage)
We have thus disaggregated PPP into three specific operating parameters:
- Revenue per Lawyer, the annual value of each lawyer in the marketplace
- Cost per Lawyer, the cost expended by a lawyer to realize that revenue
- Equity Partner Leverage, the number of lawyers relative to each equity partner
What's missing here? It's law firm size. Indeed, PPP is independent of revenue. This means that a small firm can have a high PPP; and equally a large firm can have a relatively lower PPP.
Let's look at a few examples. From the 2017 Am Law 100 rankings, we select the firm with the highest revenue and with the lowest revenue.

For Latham, each of its 2,280 lawyers realizes about $1.25 million in annual revenue. Latham has efficient cost management, it costs the firm only 50 cents of each dollar to support this revenue generation. Combining this with a high leverage ratio of 4.90 leads to a PPP in excess of $3 million, the 16th highest in the AmLaw 100.
Shook Hardy is the last ranked firm on the AmLaw 100. It's 475 lawyers realize about $700,000 in annual revenues. For each dollar of revenue, Shook expends 67 cents of cost. Such cost management places Shook in the bottom third of the AmLaw 100. Coupled with 3.5 leverage ratio, we arrive at a PPP of $800,000. Shook's revenues are an eighth of Latham; and owing to lower market value per lawyer, lower cost efficiency and lower leverage, each Shook equity partner earns $2.2 million less than one at Latham.
Comparing Peer Firms PPP
We can use our construct to compare the PPP of two peer firms, which we can identify using the data-driven approach. We need some further math to show that the PPP difference between peer Firm 1 and peer Firm 2 i.e. (PPP2 – PPP1), which can be broadly divided into three components:
- Due to difference in revenue per lawyer = Leverage1*(RPL2-RPL1)
- Due to difference in cost per lawyer = Leverage1*(CPL1-CPL2)
- Due to difference in leverage = (Leverage2-Leverage1)*(RPL2-CPL2)
We can see that in comparing two firms, relatively higher RPL, lower CPL and higher leverage all contribute to increased compensationfor each equity partner. How? A higher RPL indicates that a lawyer generates more revenue each year, either due to superior rates or by being more productive. Both are indicative of the enhanced value that the lawyer is providing to clients. Similarly, lower cost per lawyer is indicative of the firm's cost efficiency, and thus increased profits are being generated from a dollar of revenue. Finally, higher the number of lawyers for each equity partner, the more concentrated is how firm profit are distributed to equity partners. A firm with higher RPL, lower CPL and higher leverage will consequently have higher PPP. The converse also holds true. Lower RPL, higher CPL and lower leverage all combined lead to lower PPP.
It's not in every case that one firm exceeds another firm on all three parameters simultaneously. It's more likely it is higher on one or two metrics. In such situations, the outcome is determined by the combined impact of all three factors. Let's illustrate this with two peer comparisons.
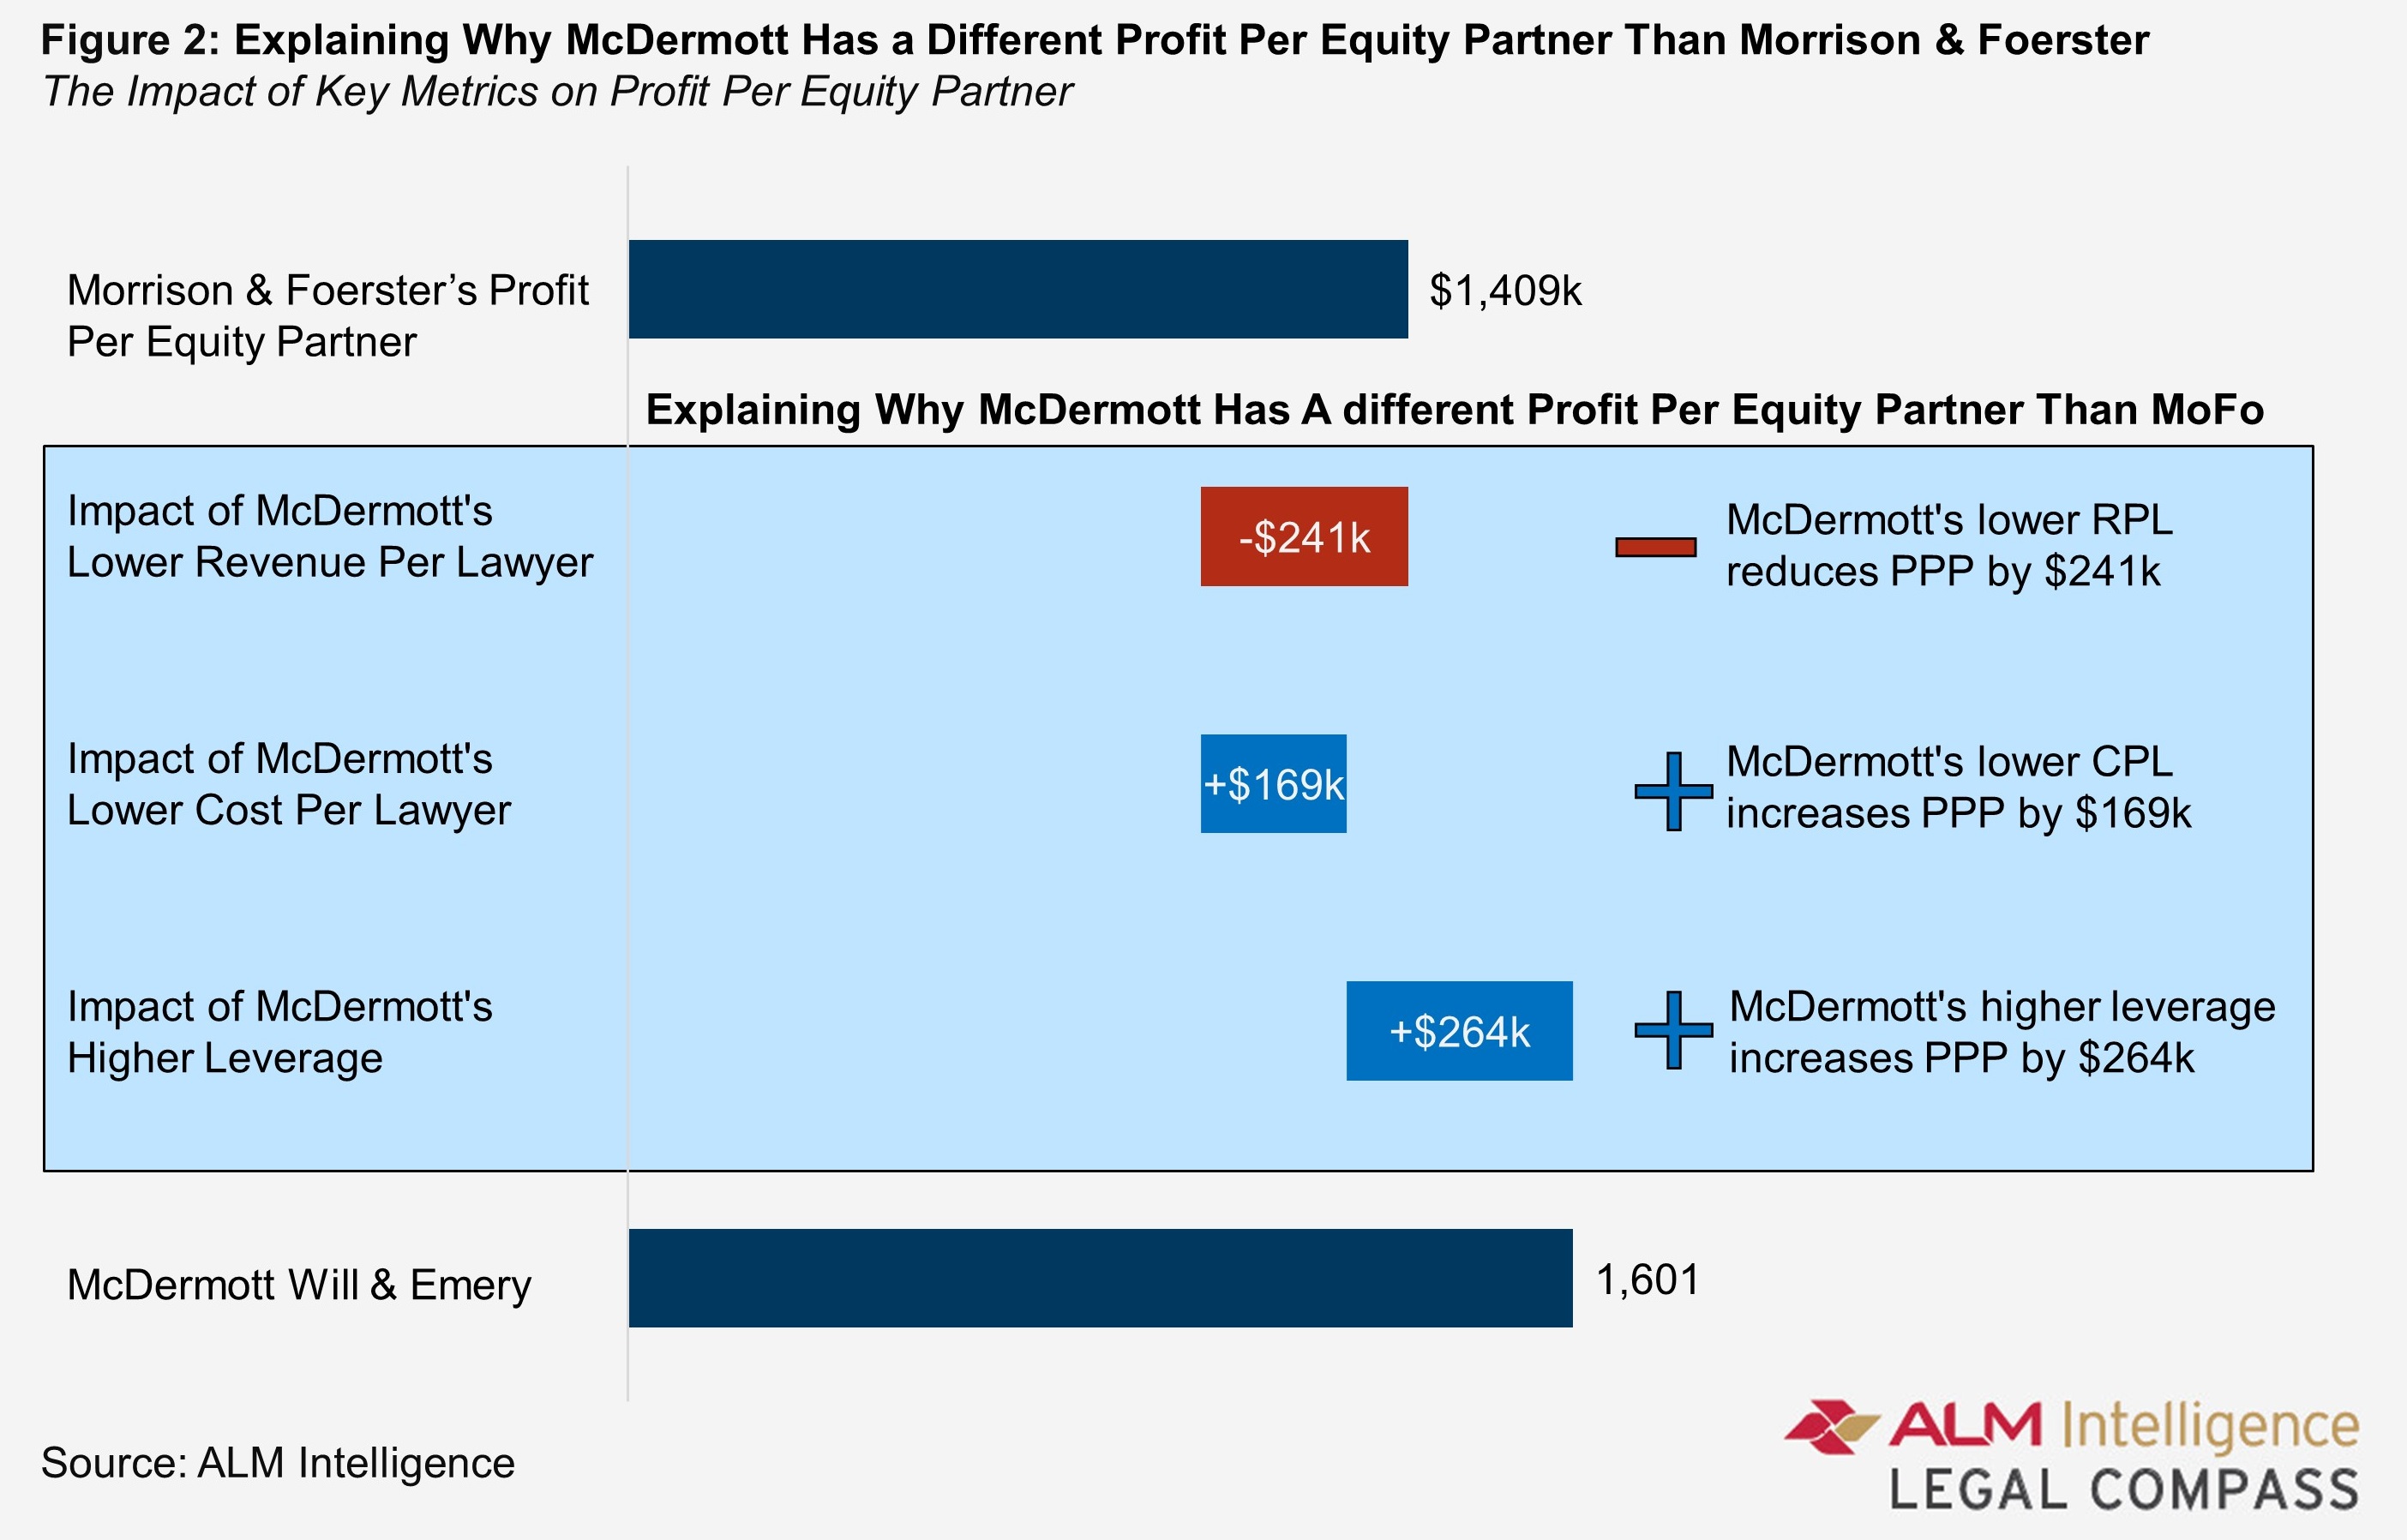
McDermott and Morrison Foerester are peer firms, but McDermott's PPP is $200,000 higher. Why?
- Lower RPL: McDermott's RPL is lower than Morrison & Foerster by $60,000, this contributes to $242,000 lower PPP.
- Lower CPL: McDermott's CPL is lower than Morrison & Foerster by $40,000, this contributes to $169,000 higher PPP.
- Higher Leverage: McDermott's Leverage is higher than Morrison & Foerster by 0.81, this contributes to $264,000 higher PPP.
McDermott's lawyers have a lower market value, but it manages costs more efficiently, and has a higher proportion of lawyers for each equity partner. The positive impact of better cost management and higher leverage offset the impact of lower revenue per lawyer and lead to a higher PPP.

Davis Polk and Paul Weiss are peers but Paul Weiss' PPP is about $620,000 higher. Why?
- Lower RPL: Paul Weiss' RPL is lower than Davis Polk by $20,000, this contributes to $115,000 lower PPP.
- Higher CPL: Paul Weiss' CPL is lower than Davis Polk by $25,000, this contributes to $137,000 higher PPP.
- Higher Leverage: Paul Weiss' leverage is higher than Davis Polk by 0.94, this contributes to $600,000 higher PPP.
Paul Weiss lawyers have a lower market value, but it manages costs more efficiently, and has a much higher proportion of lawyers for each equity partner. The negative impact of lower revenue per lawyer is almost offset by the positive impact of lower cost per lawyer. The higher leverage turns out to be the main determinant of the higher PPP.
Summary
The common way to think about PPP is that it is the annual average compensation of an equity partner. Indeed it is, but we have shown it is also the end result of three tangible operating metrics. Realizing value from clients, managing law firm costs and managing the span of professionals under an equity partner are the end-effects of the strategic and management decisions that a firm makes every single day.
The impact of operating parameters becomes even more evident when comparing PPP of two peer firms. A peer firm with relatively higher RPL, lower CPL and higher leverage will have obviously a higher PPP. Conversely, if a firm realized lower market value for each lawyer, managed costs less effectively and had a lower leverage, its PPP would be lower.
Certainly comparing PPP to peers highlights the annual compensation variances between equity partners. However, it is the combined dollar effect of the underlying parameters, including any offsets, which control with PPP difference. Indeed, the magnitude of these difference can reveal the best pathway to increase PPP. There are several available avenues to any firm: increasing standard rates, focusing on lawyer productivity, becoming more cost efficient, or managing attorney leverage. Looking deeper into the operational drivers better, especially when compared to financial peers, shows which avenue is most feasible and worthwhile to pursue. Enhancing one or more of these operational factors through smart management is the way to reach higher partner profitability.

Madhav Srinivasan is the Chief Financial Officer at Hunton Andrews Kurth LLP, leading the global finance and pricing competencies. Madhav is an ALM Intelligence Fellow and also an adjunct faculty at Columbia Law School in New York and University of Texas at Austin School of Law.
More information on the ALM Intelligence Fellows Program can be found here
This content has been archived. It is available through our partners, LexisNexis® and Bloomberg Law.
To view this content, please continue to their sites.
Not a Lexis Subscriber?
Subscribe Now
Not a Bloomberg Law Subscriber?
Subscribe Now
NOT FOR REPRINT
© 2025 ALM Global, LLC, All Rights Reserved. Request academic re-use from www.copyright.com. All other uses, submit a request to [email protected]. For more information visit Asset & Logo Licensing.
You Might Like
View All
Landlord Must Pay Prevailing Tenants' $21K Attorney Fees in Commercial Lease Dispute, Appellate Court Rules
4 minute read
State Appellate Court Settles Fee Battle Between Former Co-Counsel in Patent Litigation
5 minute read
Return to Work Mandates Among Current Mental Health Stressors for Legal Professionals
1 minute read
Internal GC Hires Rebounded in '24, but Companies Still Drawn to Outside Candidates
4 minute readTrending Stories
- 1ACC CLO Survey Waves Warning Flags for Boards
- 2States Accuse Trump of Thwarting Court's Funding Restoration Order
- 3Microsoft Becomes Latest Tech Company to Face Claims of Stealing Marketing Commissions From Influencers
- 4Coral Gables Attorney Busted for Stalking Lawyer
- 5Trump's DOJ Delays Releasing Jan. 6 FBI Agents List Under Consent Order
Who Got The Work
J. Brugh Lower of Gibbons has entered an appearance for industrial equipment supplier Devco Corporation in a pending trademark infringement lawsuit. The suit, accusing the defendant of selling knock-off Graco products, was filed Dec. 18 in New Jersey District Court by Rivkin Radler on behalf of Graco Inc. and Graco Minnesota. The case, assigned to U.S. District Judge Zahid N. Quraishi, is 3:24-cv-11294, Graco Inc. et al v. Devco Corporation.
Who Got The Work
Rebecca Maller-Stein and Kent A. Yalowitz of Arnold & Porter Kaye Scholer have entered their appearances for Hanaco Venture Capital and its executives, Lior Prosor and David Frankel, in a pending securities lawsuit. The action, filed on Dec. 24 in New York Southern District Court by Zell, Aron & Co. on behalf of Goldeneye Advisors, accuses the defendants of negligently and fraudulently managing the plaintiff's $1 million investment. The case, assigned to U.S. District Judge Vernon S. Broderick, is 1:24-cv-09918, Goldeneye Advisors, LLC v. Hanaco Venture Capital, Ltd. et al.
Who Got The Work
Attorneys from A&O Shearman has stepped in as defense counsel for Toronto-Dominion Bank and other defendants in a pending securities class action. The suit, filed Dec. 11 in New York Southern District Court by Bleichmar Fonti & Auld, accuses the defendants of concealing the bank's 'pervasive' deficiencies in regards to its compliance with the Bank Secrecy Act and the quality of its anti-money laundering controls. The case, assigned to U.S. District Judge Arun Subramanian, is 1:24-cv-09445, Gonzalez v. The Toronto-Dominion Bank et al.
Who Got The Work
Crown Castle International, a Pennsylvania company providing shared communications infrastructure, has turned to Luke D. Wolf of Gordon Rees Scully Mansukhani to fend off a pending breach-of-contract lawsuit. The court action, filed Nov. 25 in Michigan Eastern District Court by Hooper Hathaway PC on behalf of The Town Residences LLC, accuses Crown Castle of failing to transfer approximately $30,000 in utility payments from T-Mobile in breach of a roof-top lease and assignment agreement. The case, assigned to U.S. District Judge Susan K. Declercq, is 2:24-cv-13131, The Town Residences LLC v. T-Mobile US, Inc. et al.
Who Got The Work
Wilfred P. Coronato and Daniel M. Schwartz of McCarter & English have stepped in as defense counsel to Electrolux Home Products Inc. in a pending product liability lawsuit. The court action, filed Nov. 26 in New York Eastern District Court by Poulos Lopiccolo PC and Nagel Rice LLP on behalf of David Stern, alleges that the defendant's refrigerators’ drawers and shelving repeatedly break and fall apart within months after purchase. The case, assigned to U.S. District Judge Joan M. Azrack, is 2:24-cv-08204, Stern v. Electrolux Home Products, Inc.
Featured Firms
Law Offices of Gary Martin Hays & Associates, P.C.
(470) 294-1674
Law Offices of Mark E. Salomone
(857) 444-6468
Smith & Hassler
(713) 739-1250


