Three Decades of Am Law Profit Margins
AmLaw 100 profit margins have followed a cyclical pattern. Profit margin, RPL and CPL decrease during US recessions years, but do increase subsequently. This is article 1 of a five-article series.
April 11, 2019 at 01:32 PM
8 minute read
I was looking recently at profit margin (defined as operating income divided by revenue) for the combined 2018 AmLaw 100 firms; and noticed that at 40.03%, it was at its highest value in almost 30 years. In 1987, the American Lawyer first published the full AmLaw 100 firms ranking and reported a profit margin of 40.14% – a level which has not been exceeded since. This unusual finding prompted me to embark on a deeper review of the profit margins of the AmLaw 100 (Log Into Legal Compass To View the Am Law 100).
Three Profit Margin Shapes in 30 Years
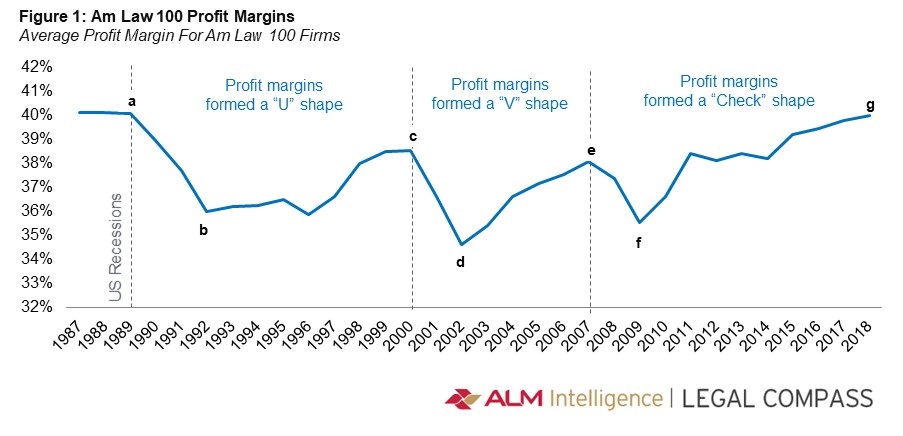
When I plotted the profit margin curve of the combined AmLaw 100 firms, as reported in each year, for the thirty year period from 1986 to 2018, there appeared to be three distinct profiles. For simplicity and to express their geometric shape, they could be elegantly classified as a “U” from 1987 to 2000; a “V” from 2000 to 2007 and a “Check” from 2007 to 2018 (see figure 1). Such a characterization turned out to be quite useful – it enabled the demarcation of patterns within each shape as also comparison of cyclicality across shapes. We can notice that the curve has distinctly visible peaks and troughs which appear directly related to, and contemporaneous with, economic recessions in the US. There have been three such recessions since 1987: in calendar 1990-1991, in 2001 and in 2007-2009. Further, it is interesting to note that even with dramatic changes in the global economy and a 13-fold increase in combined AmLaw 100 revenues, profit margin reached a minimum level of only 34.64% (point (d) in 2002), a testament to law firms' enduring financial strength over time.
Looking deeper into the composition of the AmLaw 100 firms in 2018, we note that, 81 of these were included 10 years ago in the 2008 AmLaw 100; 72 were included 20 years ago in 1998; 61 were included 30 years ago in 1988; and also 61 were included in 1987, the first year AmLaw 100 was published. Our analysis is based on AmLaw data in the year it was reported, but for purposes of simplicity, we will not consider any impacts of such compositional changes.

Profit Margin Shapes – Falls and Rises
In the “U” and “V” shapes, we can notice that profit margin peaks just before the recession, drops sharply during the recession and recovers after the recession is over – but not to pre-recession levels. However, the “Check” shape is somewhat different. We see a similar drop in profit margin, but the recovery has been longer and stronger, driving profit margin higher to near-record levels.
Can we do some analytics on these curves for additional insights? It is interesting to quantify the percentage decrease from first peak to trough as also the increase from trough to second peak (see figure 2). We can see the falls ( the percentage difference between the pre-recession profit margin and at-recession profit margin) has been decreasing over time. The difference between point (a) and (b) was 4.07% in the 1990 recession; the difference between point (c) and point (d) was 3.93% in the 2001 recession; and the difference between point ( e) and point (f) was 2.51% in the 2007 recession. The rises (the percentage difference between at-recession profit margin and post-recession profit margin) has been doing quite the opposite – and increasing over time. The difference from point (b) to point (c) was 2.56% in the 1990 recession; the difference between point (d) to point ( e) was 3.45% in the 2001 recession; and the difference between point (f) to point (g) was 4.45% in the 2007 recession. The sequential decrease in falls and conversely the sequential increase in rises indicates law firms have been able to improve their profit management each time over the last three recessions. Owing to such proactive management, the negative impact of recessions appears to have been softening, while the post-recession recovery appears to be strengthening. This analysis will help us estimate profit margin impact of the next recession, a topic we will explore in future articles.

Projecting Future Profit Margin
Can we better understand these trends in profit margins? Rather than looking at profits by analyzing the components of the income statement, we propose a slightly different approach. We turn to two frequently used metrics – Revenue per Lawyer (RPL) and Cost per Lawyer (CPL). By dividing revenues and costs by the number of lawyers, we achieve standardization and thus can compare across firms and equally across years, all of which produces much richer insights.
Expressed in these terms, Profit Margin is simply 1 – (CPL/ RPL). If we wish to show the profit margin for any future year, say T years from this current year 0, we can arrive at a formula which uses not only current RPL and CPL, but also their cumulative average annual growth rate % (CAGR):

We are now able to describe future profit margin in terms of known and commonly estimated factors in a standardized way across all law firms and across multiple years. This formula shows that future profit margins are impacted by two factors: the current level of profit margin; and the differential between the growth rate % between RPL and CPL. Analyzing further, we can see profit margin rises when the RPL growth rate % exceeds the CPL growth rate %; and conversely profit margin falls when the CPL growth rate % exceeds the RPL growth rate %. Also, for the same differential in growth rates, the trajectory of projected future profit margins is flatter when current profit margin is high; and steeper when current profit margin is low, an interesting factor which we will look into detail later.
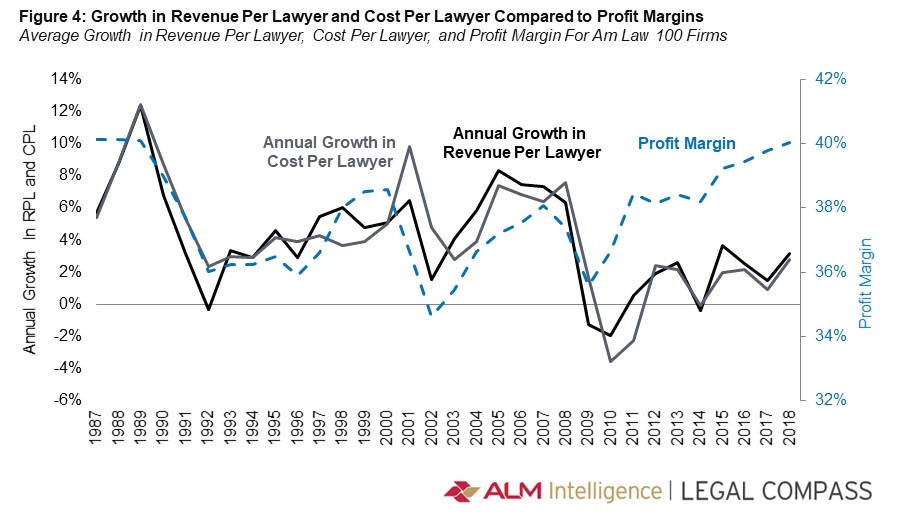
Now let's plot the annual increase % in RPL and CPL along with profit margin (see figure 4). We can see similar cyclicality and patterns. There are comparable peaks and valleys, but these are slightly offset from that of profit margins by a year or two. Also, we notice profit margin rises when the RPL curve is higher than the CPL curve; and conversely profit margin falls when the CPL curve is higher than the RPL curve.
Linking Profit Margin to RPL and CPL Growth
An elegant way to link RPL, CPL and profit margin is to consider the rate of change in the annual percentage increase or decrease in RPL and CPL. This is a second order effect reflecting either acceleration or deceleration in the percentage rate of change itself. At the onset of recession we see profit margin drops. Why? Deceleration in RPL exceeds the deceleration in CPL. Analogously, after the recession, profit margin increases when acceleration in RPL exceeds acceleration in CPL. This makes intuitive sense as recessionary forces first cause a reduction in demand, which drags down RPL faster than firms can restrain costs. Subsequently law firms takes measures to control costs, pushing down CPL, which offsets the drop in profit margin. Then as recession fades, RPL rises rapidly due to burgeoning demand; CPL also follows as cost pressures increase – and this pushes profit margins higher.

The “Check” Shape
Let's look at the most recent “Check” shape in more detail as it has implications for 2019 and 2020. It's pattern is quite different from the prior two in many ways. First, RPL and CPL growth curves plunged below zero percent for a period spanning three years – a unique occurrence, indicating the recession's high economic severity. Second, the effective deceleration in CPL was higher than the deceleration in RPL as firms controlled costs stringently, leading to a much smaller peak-to-trough drop in profit margins. Third, RPL and CPL recovered more slowly owing to a relatively lower acceleration rate in both parameters. Fourth, post-recession levels of RPL and CPL growth rates are lower compared to previous two recessions, averaging only 2% for the past six years. Fifth, RPL growth rate is generally higher than CPL growth rate, leading to a sequential and longest-duration increase in profit margins from 2009 to 2018. Finally, profit margin has exceeded the previous peak; and is close to the historically high levels of 1987.
Summary
Profit margin for the AmLaw 100 has followed a fascinating pattern over three decades. While margin has decreased contemporaneously with US recessions, they have bounced back, and reached only a minimum of 35%. Despite enormous changes in the external environment, law firms have remained quite resilient to downward pressures on profitability. The 2007 to 2009 great recession led to sharp decline in profit margin, but the subsequent increase to historic levels shows good management of revenues and costs.

Madhav Srinivasan is the Chief Financial Officer at Hunton Andrews Kurth LLP, leading the global finance and pricing competencies. Madhav is an ALM Intelligence Fellow and also an adjunct faculty at Columbia Law School in New York and University of Texas at Austin School of Law.
More information on the ALM Intelligence Fellows Program can be found here
This content has been archived. It is available through our partners, LexisNexis® and Bloomberg Law.
To view this content, please continue to their sites.
Not a Lexis Subscriber?
Subscribe Now
Not a Bloomberg Law Subscriber?
Subscribe Now
NOT FOR REPRINT
© 2025 ALM Global, LLC, All Rights Reserved. Request academic re-use from www.copyright.com. All other uses, submit a request to [email protected]. For more information visit Asset & Logo Licensing.
You Might Like
View All

Big Law Sidelined as Asian IPOs in New York Are Dominated by Small Cap Listings

Greenberg Traurig Combines Digital Infrastructure and Real Estate Groups, Anticipating Uptick in Demand
4 minute readTrending Stories
- 1Uber Files RICO Suit Against Plaintiff-Side Firms Alleging Fraudulent Injury Claims
- 2The Law Firm Disrupted: Scrutinizing the Elephant More Than the Mouse
- 3Inherent Diminished Value Damages Unavailable to 3rd-Party Claimants, Court Says
- 4Pa. Defense Firm Sued by Client Over Ex-Eagles Player's $43.5M Med Mal Win
- 5Losses Mount at Morris Manning, but Departing Ex-Chair Stays Bullish About His Old Firm's Future
Who Got The Work
J. Brugh Lower of Gibbons has entered an appearance for industrial equipment supplier Devco Corporation in a pending trademark infringement lawsuit. The suit, accusing the defendant of selling knock-off Graco products, was filed Dec. 18 in New Jersey District Court by Rivkin Radler on behalf of Graco Inc. and Graco Minnesota. The case, assigned to U.S. District Judge Zahid N. Quraishi, is 3:24-cv-11294, Graco Inc. et al v. Devco Corporation.
Who Got The Work
Rebecca Maller-Stein and Kent A. Yalowitz of Arnold & Porter Kaye Scholer have entered their appearances for Hanaco Venture Capital and its executives, Lior Prosor and David Frankel, in a pending securities lawsuit. The action, filed on Dec. 24 in New York Southern District Court by Zell, Aron & Co. on behalf of Goldeneye Advisors, accuses the defendants of negligently and fraudulently managing the plaintiff's $1 million investment. The case, assigned to U.S. District Judge Vernon S. Broderick, is 1:24-cv-09918, Goldeneye Advisors, LLC v. Hanaco Venture Capital, Ltd. et al.
Who Got The Work
Attorneys from A&O Shearman has stepped in as defense counsel for Toronto-Dominion Bank and other defendants in a pending securities class action. The suit, filed Dec. 11 in New York Southern District Court by Bleichmar Fonti & Auld, accuses the defendants of concealing the bank's 'pervasive' deficiencies in regards to its compliance with the Bank Secrecy Act and the quality of its anti-money laundering controls. The case, assigned to U.S. District Judge Arun Subramanian, is 1:24-cv-09445, Gonzalez v. The Toronto-Dominion Bank et al.
Who Got The Work
Crown Castle International, a Pennsylvania company providing shared communications infrastructure, has turned to Luke D. Wolf of Gordon Rees Scully Mansukhani to fend off a pending breach-of-contract lawsuit. The court action, filed Nov. 25 in Michigan Eastern District Court by Hooper Hathaway PC on behalf of The Town Residences LLC, accuses Crown Castle of failing to transfer approximately $30,000 in utility payments from T-Mobile in breach of a roof-top lease and assignment agreement. The case, assigned to U.S. District Judge Susan K. Declercq, is 2:24-cv-13131, The Town Residences LLC v. T-Mobile US, Inc. et al.
Who Got The Work
Wilfred P. Coronato and Daniel M. Schwartz of McCarter & English have stepped in as defense counsel to Electrolux Home Products Inc. in a pending product liability lawsuit. The court action, filed Nov. 26 in New York Eastern District Court by Poulos Lopiccolo PC and Nagel Rice LLP on behalf of David Stern, alleges that the defendant's refrigerators’ drawers and shelving repeatedly break and fall apart within months after purchase. The case, assigned to U.S. District Judge Joan M. Azrack, is 2:24-cv-08204, Stern v. Electrolux Home Products, Inc.
Featured Firms
Law Offices of Gary Martin Hays & Associates, P.C.
(470) 294-1674
Law Offices of Mark E. Salomone
(857) 444-6468
Smith & Hassler
(713) 739-1250


