Soaring Debt Loads and Plunging Bar Pass Rates: Legal Education by the Numbers
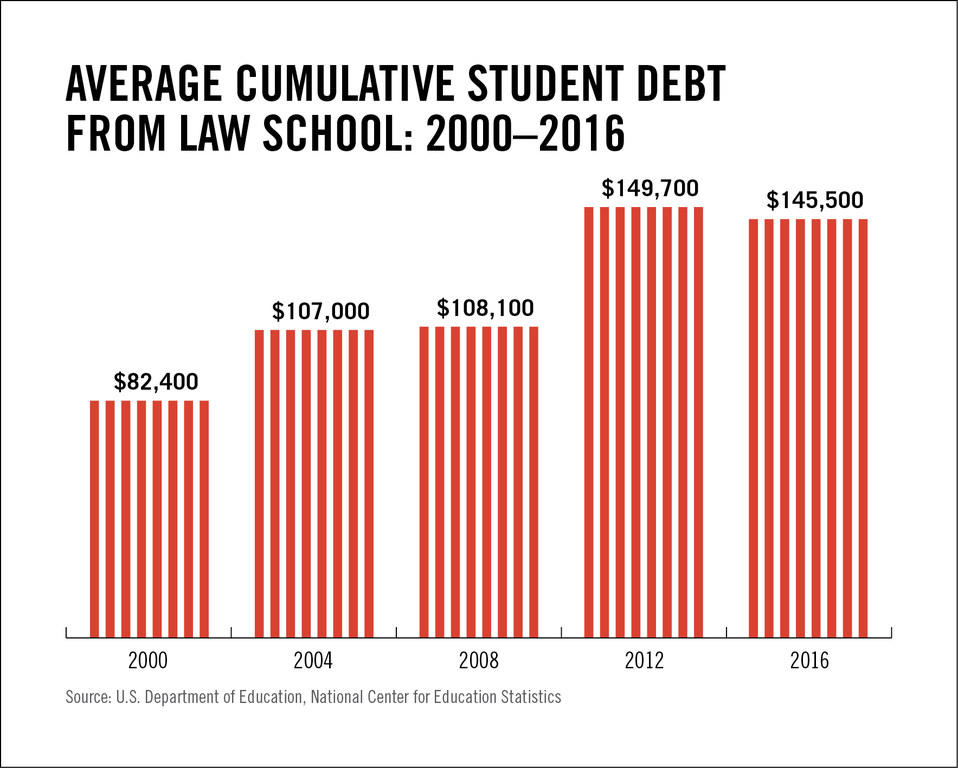
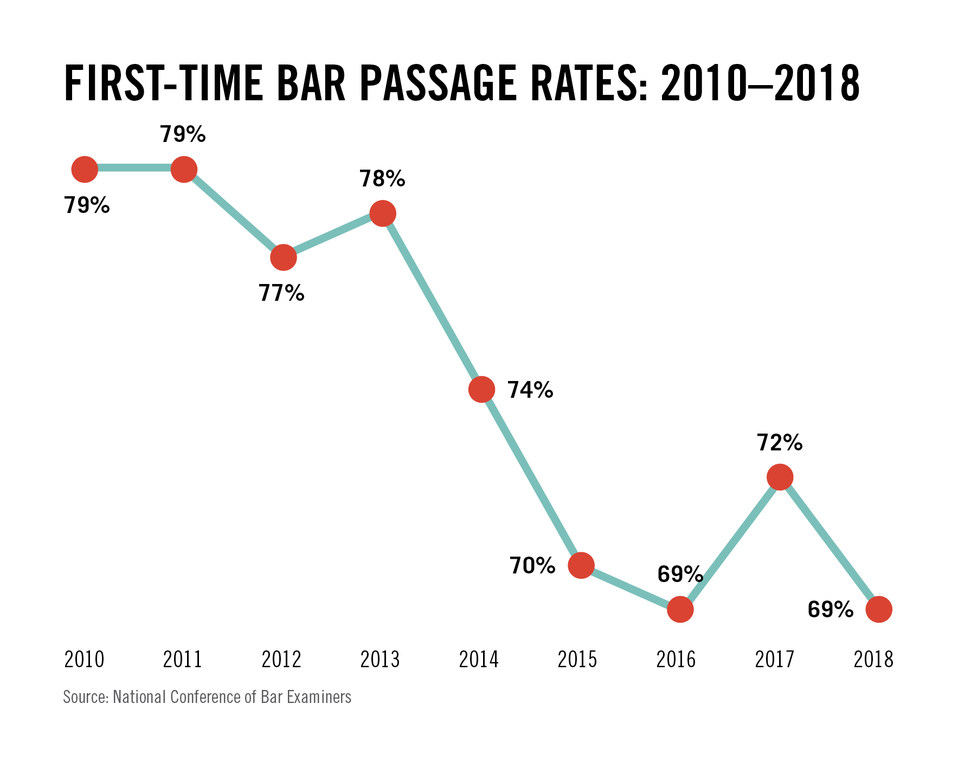
The average debt load of law graduates has hit $145,500 according to figures compiled by the American Bar Association. Meanwhile, bar pass rates have sunk and far fewer people are applying to law school.
August 14, 2019 at 02:01 PM
1 minute read
 Photo: Shutterstock
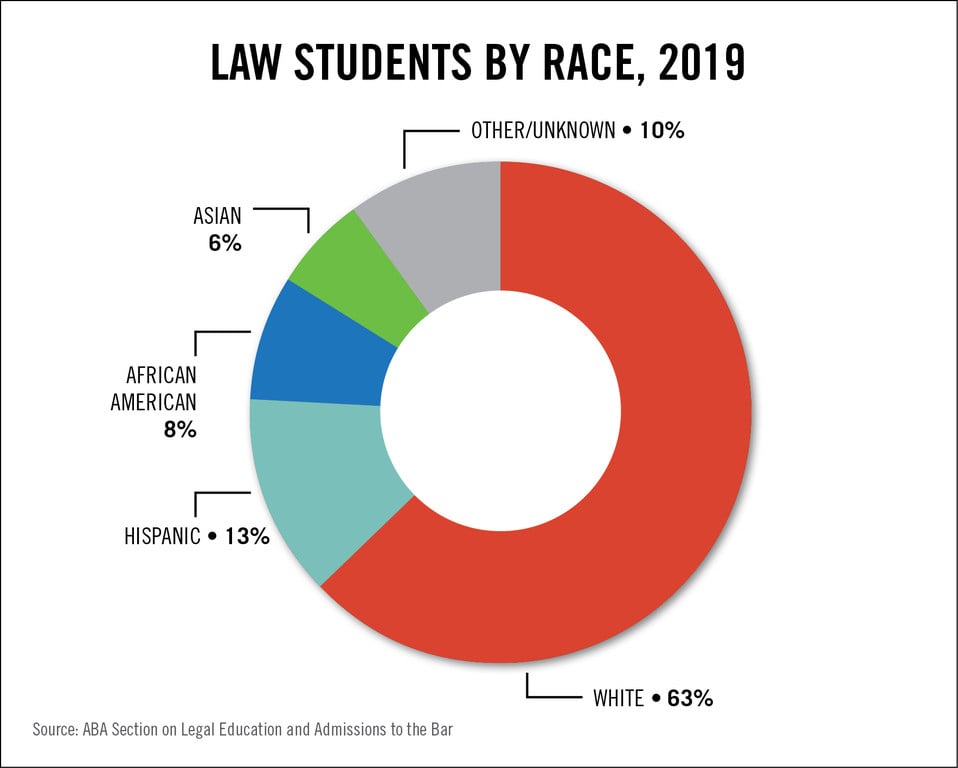
The American Bar Association has released a trove of statistics relating to the legal profession, and Law.com is spending this week poring over the data. Today, we’re focusing on the nation’s law schools. We’ve got charts breaking down the racial demographics of the student body; the amount of educational debt law graduates take on; the percentage of grads who pass the bar on the first try; and the size of the law school applicant pool.

Read more:
Just How White and Male Is the Federal Judiciary? Here Are the Numbers
By the Numbers: Lawyer Salary Increases in the Past Two Decades
This content has been archived. It is available through our partners, LexisNexis® and Bloomberg Law.
To view this content, please continue to their sites.
Not a Lexis Subscriber?
Subscribe Now
Not a Bloomberg Law Subscriber?
Subscribe Now
NOT FOR REPRINT
© 2025 ALM Global, LLC, All Rights Reserved. Request academic re-use from www.copyright.com. All other uses, submit a request to [email protected]. For more information visit Asset & Logo Licensing.
You Might Like
View All
Pennsylvania Law Schools Are Seeing Double-Digit Boosts in 2025 Applications
5 minute read
What’s at Stake in Supreme Court Case Over Religious Charter School?

University of New Hampshire Law School Launches Specialized Health, Life Sciences Program

Supreme Court Takes Up Case Over Approval of Religious Charter School
Trending Stories
- 1Uber Files RICO Suit Against Plaintiff-Side Firms Alleging Fraudulent Injury Claims
- 2The Law Firm Disrupted: Scrutinizing the Elephant More Than the Mouse
- 3Inherent Diminished Value Damages Unavailable to 3rd-Party Claimants, Court Says
- 4Pa. Defense Firm Sued by Client Over Ex-Eagles Player's $43.5M Med Mal Win
- 5Losses Mount at Morris Manning, but Departing Ex-Chair Stays Bullish About His Old Firm's Future

Featured Firms
Law Offices of Gary Martin Hays & Associates, P.C.
(470) 294-1674
Law Offices of Mark E. Salomone
(857) 444-6468
Smith & Hassler
(713) 739-1250