50 States of New Summer COVID-19 Wave Death Data, Plus D.C.
Our latest college and university dashboard suggests that careful schools may be getting the virus under control.
September 29, 2020 at 03:12 PM
14 minute read
State RegulationThe original version of this story was published on Law.com
Resources
- The Dynata COVID-19 symptom maps and charts are available here.
- The COVID Tracking Project at The Atlantic is available here.
- The Johns Hopkins Coronavirus Resource Center numbers are available here.
- The CDC's weekly COVID-19 report is available here.
- The HHS hospital capacity data is available here.
- An overview article about the COVID-19 data for the previous week is available here.
The Dynata Data
Dynata, a data firm, powers many website instant survey programs. In place of its regular surveys, it serves some site users a COVID-19 symptom survey. The company than feeds the survey data into a free, public — but copyrighted — tracking dashboard. The percentage of Dynata survey participants ages 18 to 24 who said they had a dry cough with loss of the sense of smell or taste was 3% for the two-week period ending Sept. 25, That's down from 3.1% for the two-week period ending Sept. 18, as many college students with in-person classes started heading to campus. The number of states where 3.5% or more of the college-age Dynata survey takers said they had COVID-19-like symptoms fell to four, from five for the two-week period ending Sept. 18. College-age survey taker symptom rates were highest in Arkansas, Nevada, North Dakota and South Dakota. In South Dakota, 22% of the 60 survey respondents in the 18-24 age group said they had a dry cough with loss of the sense of taste or smell. The second worst-hit state, Nevada, had a symptom report rate of 5% for that age group. Some COVID-19 watchers say the 80th Sturgis Motorcycle Rally, a 10-day event that started Aug. 7 in Sturgis, South Dakota, may have contributed to a sharp increase in the infection rate in South Dakota. The event attracted about 460,000 attendees, according to the South Dakota State News. The IA Institute of Labor Economics has predicted that the rally will eventually cause about 250,000 cases of COVID-19, with the rally infecting some attendees directly; those attendees transmitting the virus that causes the disease to other people; and the people with indirect exposure than transmitting the virus in their own communities.
The ThinkAdvisor Campus COVID-19 Dashboard Tracker
Some colleges and universities report daily COVID-19 test results on dashboard websites. Campus tracking numbers are of interest because some pandemic trackers say schools could produce a big fall COVID-19 wave. We created a table using one-day test results, for Sept. 25, from dashboards that reported both test counts and positive results counts. For the 18 colleges and universities in our table, the total number of tests reported increased to 32,574, from 30,365. The number of samples found to show signs of COVID-19 fell to 289, from 453. Some schools increased the amount of data reported for Sept. 18 between last week and this week. The percentage of test samples found to show signs of COVID-19 fell to 0.9% for the Sept. 25 test data, from 1.4% for the Sept. 18 test data. Only a small number of colleges and universities report daily test totals and positive results counts on a web dashboard. The positivity rates at the schools with daily results on a dashboard may be different from the results at the typical college or university. But the results appear to suggest that schools that are tracking COVID-19 carefully might have a shot at getting the spread of the virus that causes the disease under control. .
U.S. University COVID-19 Case Tracker (Results for Sept. 25) | ||||
| School | Tests | Positive | % Positive, Sept. 25 | % Positive, Sept. 18 |
|---|---|---|---|---|
| Arizona, University of | 1,051 | 36 | 3.4% | 6.1% |
| California at Berkeley, University of | 1,244 | 1 | 0.1% | 0.2% |
| Colorado, University of | 957 | 77 | 8.0% | 10.2% |
| George Washington University | 276 | - | 0.0% | 0.0% |
| Illinois, University of | 11,090 | 41 | 0.4% | 0.3% |
| Lasell University | 428 | - | 0.0% | 0.0% |
| Massachusetts Institute of Technology | 3,168 | 1 | 0.0% | 0.1% |
| Miami, University of | 581 | 3 | 0.5% | 0.7% |
| Michigan Technological University | 181 | 4 | 2.2% | 5.2% |
| Nebraska-Lincoln, University of | 97 | 9 | 9.3% | 12.6% |
| Ohio State University | 2,798 | 37 | 1.3% | 2.2% |
| Rhode Island School of Design | 153 | - | 0.0% | 0.0% |
| Rice University | 1,021 | 2 | 0.2% | 0.2% |
| State University of New York system | 4,466 | 32 | 0.7% | 0.3% |
| Tulane University | 1,281 | 22 | 1.7% | 1.2% |
| Wisconsin, University of | 1,658 | 22 | 1.3% | 4.9% |
| Yale University | 2,124 | 2 | 0.1% | 0.0% |
| OVERALL | 32,574 | 289 | 0.9% | 1.4% |
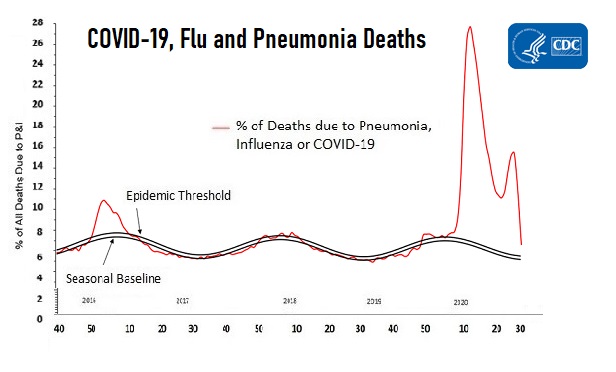
Ratio of All Reported Deaths to Expected Deaths | ||||
| (as of Aug. 22) | ||||
|---|---|---|---|---|
| State | COVID-19 Deaths | Pneumonia, Influenza, or COVID-19 Deaths | Total Deaths | RATIO of Total Deaths to Expected Deaths |
| Alabama | 195 | 247 | 1,210 | 1.3 |
| Alaska | NA | NA | 86 | 1.02 |
| Arizona | 165 | 216 | 1,467 | 1.4 |
| Arkansas | 89 | 131 | 723 | 1.27 |
| California | 808 | 1,058 | 6,356 | 1.36 |
| Colorado | 18 | 44 | 851 | 1.18 |
| Connecticut | NA | 10 | 329 | 0.6 |
| Delaware | NA | 12 | 172 | 1 |
| District of Columbia | 11 | 16 | 101 | 0.92 |
| Florida | 928 | 1,191 | 5,146 | 1.4 |
| Georgia | 374 | 452 | 2,004 | 1.3 |
| Hawaii | 10 | 21 | 241 | 1.16 |
| Idaho | 56 | 62 | 359 | 1.42 |
| Illinois | 95 | 194 | 2,127 | 1.13 |
| Indiana | 91 | 161 | 1,289 | 1.1 |
| Iowa | 61 | 92 | 594 | 1.09 |
| Kansas | 37 | 58 | 504 | 1.1 |
| Kentucky | 66 | 128 | 951 | 1.11 |
| Louisiana | 171 | 192 | 936 | 1.12 |
| Maine | NA | 16 | 312 | 1.19 |
| Maryland | 59 | 105 | 986 | 1.11 |
| Massachusetts | 33 | 81 | 1,024 | 0.98 |
| Michigan | 56 | 148 | 1,880 | 1.12 |
| Minnesota | 55 | 93 | 863 | 1.06 |
| Mississippi | 181 | 224 | 770 | 1.35 |
| Missouri | 91 | 142 | 1,268 | 1.09 |
| Montana | 10 | 12 | 234 | 1.25 |
| Nebraska | 27 | 43 | 355 | 1.14 |
| Nevada | 96 | 125 | 612 | 1.37 |
| New Hampshire | NA | 15 | 249 | 1.12 |
| New Jersey | 35 | 81 | 1,333 | 0.98 |
| New Mexico | 20 | 32 | 363 | 1.16 |
| New York | 32 | 136 | 1,864 | 1.05 |
| New York City | 20 | 77 | 960 | 0.99 |
| North Carolina | 33 | 40 | 274 | 0.16 |
| North Dakota | NA | 14 | 87 | 0.66 |
| Ohio | 159 | 265 | 2,476 | 1.12 |
| Oklahoma | 63 | 120 | 824 | 1.18 |
| Oregon | 22 | 47 | 744 | 1.13 |
| Pennsylvania | 95 | 198 | 2,575 | 1.08 |
| Rhode Island | 13 | 20 | 188 | 0.97 |
| South Carolina | 199 | 238 | 1,157 | 1.35 |
| South Dakota | NA | 21 | 151 | 1.06 |
| Tennessee | 128 | 229 | 1,631 | 1.21 |
| Texas | 904 | 1,106 | 4,743 | 1.27 |
| Utah | 18 | 36 | 418 | 1.18 |
| Vermont | 0 | NA | 117 | 1.27 |
| Virginia | 121 | 161 | 1,427 | 1.16 |
| Washington | 50 | 105 | 1,180 | 1.18 |
| West Virginia | 25 | 37 | 219 | 0.55 |
| Wisconsin | 38 | 77 | 1,052 | 1.12 |
| Wyoming | NA | NA | 95 | 1.16 |
| United States | 5,793 | 8,351 | 57,877 | 1.14 |
NOT FOR REPRINT
© 2025 ALM Global, LLC, All Rights Reserved. Request academic re-use from www.copyright.com. All other uses, submit a request to [email protected]. For more information visit Asset & Logo Licensing.
You Might Like
View AllTrending Stories
Who Got The Work
J. Brugh Lower of Gibbons has entered an appearance for industrial equipment supplier Devco Corporation in a pending trademark infringement lawsuit. The suit, accusing the defendant of selling knock-off Graco products, was filed Dec. 18 in New Jersey District Court by Rivkin Radler on behalf of Graco Inc. and Graco Minnesota. The case, assigned to U.S. District Judge Zahid N. Quraishi, is 3:24-cv-11294, Graco Inc. et al v. Devco Corporation.
Who Got The Work
Rebecca Maller-Stein and Kent A. Yalowitz of Arnold & Porter Kaye Scholer have entered their appearances for Hanaco Venture Capital and its executives, Lior Prosor and David Frankel, in a pending securities lawsuit. The action, filed on Dec. 24 in New York Southern District Court by Zell, Aron & Co. on behalf of Goldeneye Advisors, accuses the defendants of negligently and fraudulently managing the plaintiff's $1 million investment. The case, assigned to U.S. District Judge Vernon S. Broderick, is 1:24-cv-09918, Goldeneye Advisors, LLC v. Hanaco Venture Capital, Ltd. et al.
Who Got The Work
Attorneys from A&O Shearman has stepped in as defense counsel for Toronto-Dominion Bank and other defendants in a pending securities class action. The suit, filed Dec. 11 in New York Southern District Court by Bleichmar Fonti & Auld, accuses the defendants of concealing the bank's 'pervasive' deficiencies in regards to its compliance with the Bank Secrecy Act and the quality of its anti-money laundering controls. The case, assigned to U.S. District Judge Arun Subramanian, is 1:24-cv-09445, Gonzalez v. The Toronto-Dominion Bank et al.
Who Got The Work
Crown Castle International, a Pennsylvania company providing shared communications infrastructure, has turned to Luke D. Wolf of Gordon Rees Scully Mansukhani to fend off a pending breach-of-contract lawsuit. The court action, filed Nov. 25 in Michigan Eastern District Court by Hooper Hathaway PC on behalf of The Town Residences LLC, accuses Crown Castle of failing to transfer approximately $30,000 in utility payments from T-Mobile in breach of a roof-top lease and assignment agreement. The case, assigned to U.S. District Judge Susan K. Declercq, is 2:24-cv-13131, The Town Residences LLC v. T-Mobile US, Inc. et al.
Who Got The Work
Wilfred P. Coronato and Daniel M. Schwartz of McCarter & English have stepped in as defense counsel to Electrolux Home Products Inc. in a pending product liability lawsuit. The court action, filed Nov. 26 in New York Eastern District Court by Poulos Lopiccolo PC and Nagel Rice LLP on behalf of David Stern, alleges that the defendant's refrigerators’ drawers and shelving repeatedly break and fall apart within months after purchase. The case, assigned to U.S. District Judge Joan M. Azrack, is 2:24-cv-08204, Stern v. Electrolux Home Products, Inc.
Featured Firms
Law Offices of Gary Martin Hays & Associates, P.C.
(470) 294-1674
Law Offices of Mark E. Salomone
(857) 444-6468
Smith & Hassler
(713) 739-1250


