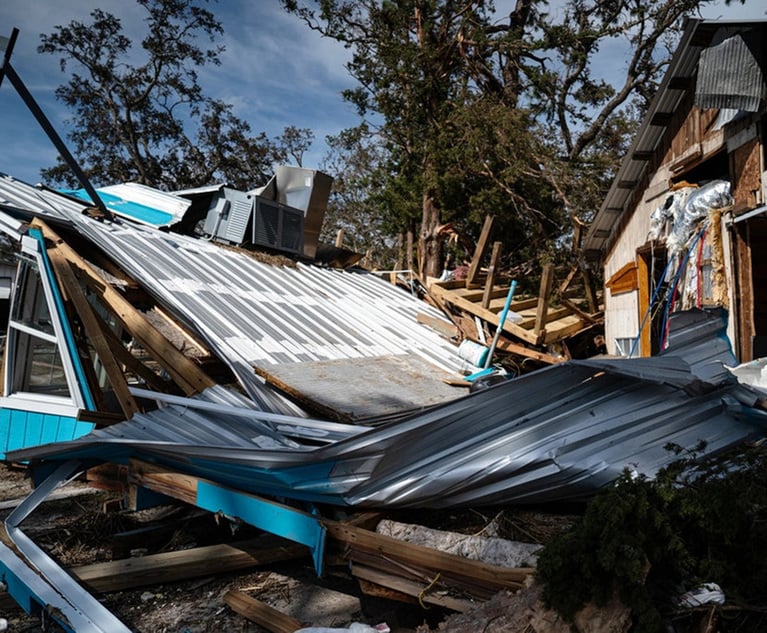
Florida Among 10 States Hit Hardest by Natural Disasters
The increasing number of natural disasters hitting the U.S. hasn't affected all regions equally, and some states are shelling out billions annually to recover from these events.
January 06, 2022 at 02:00 PM
2 minute read
InsuranceThe original version of this story was published on Law.com
- From 1980 to 1989, the U.S. averaged 2.9 billion-dollar disasters per year, with an average annual cost of $18.7 billion.
- From 1990 to 1999, the U.S. averaged 5.3 billion-dollar disasters per year, with an average annual cost of $28.9 billion.
- From 2000 to 2009, the U.S. averaged 6.3 billion-dollar disasters per year, with an average annual cost of $54.7 billion.
- From 2010 to 2019, the U.S. averaged 12.3 billion-dollar disasters per year, with an average annual cost of $85.8 billion.
- In 2020 alone, there were 22 billion-dollar disasters with a total cost of $100.2 billion.
Related:
This content has been archived. It is available through our partners, LexisNexis® and Bloomberg Law.
To view this content, please continue to their sites.
Not a Lexis Subscriber?
Subscribe Now
Not a Bloomberg Law Subscriber?
Subscribe Now
NOT FOR REPRINT
© 2025 ALM Global, LLC, All Rights Reserved. Request academic re-use from www.copyright.com. All other uses, submit a request to [email protected]. For more information visit Asset & Logo Licensing.
You Might Like
View All
Attorneys, Health Care Officials Face Nearly $80M RICO Suit Over Allegedly Fabricated Spreadsheet

Navigating Florida Property Insurance Claims in a Post-Fee-Shifting World
5 minute read
Trying to Reason With Hurricane Season: Mediating First Party Property Insurance Claims

Amid Growing Litigation Volume, Don't Expect UnitedHealthcare to Change Its Stripes After CEO's Killing
6 minute readTrending Stories
- 1'It's Not Going to Be Pretty': PayPal, Capital One Face Novel Class Actions Over 'Poaching' Commissions Owed Influencers
- 211th Circuit Rejects Trump's Emergency Request as DOJ Prepares to Release Special Counsel's Final Report
- 3Supreme Court Takes Up Challenge to ACA Task Force
- 4'Tragedy of Unspeakable Proportions:' Could Edison, DWP, Face Lawsuits Over LA Wildfires?
- 5Meta Pulls Plug on DEI Programs
Who Got The Work
Michael G. Bongiorno, Andrew Scott Dulberg and Elizabeth E. Driscoll from Wilmer Cutler Pickering Hale and Dorr have stepped in to represent Symbotic Inc., an A.I.-enabled technology platform that focuses on increasing supply chain efficiency, and other defendants in a pending shareholder derivative lawsuit. The case, filed Oct. 2 in Massachusetts District Court by the Brown Law Firm on behalf of Stephen Austen, accuses certain officers and directors of misleading investors in regard to Symbotic's potential for margin growth by failing to disclose that the company was not equipped to timely deploy its systems or manage expenses through project delays. The case, assigned to U.S. District Judge Nathaniel M. Gorton, is 1:24-cv-12522, Austen v. Cohen et al.
Who Got The Work
Edmund Polubinski and Marie Killmond of Davis Polk & Wardwell have entered appearances for data platform software development company MongoDB and other defendants in a pending shareholder derivative lawsuit. The action, filed Oct. 7 in New York Southern District Court by the Brown Law Firm, accuses the company's directors and/or officers of falsely expressing confidence in the company’s restructuring of its sales incentive plan and downplaying the severity of decreases in its upfront commitments. The case is 1:24-cv-07594, Roy v. Ittycheria et al.
Who Got The Work
Amy O. Bruchs and Kurt F. Ellison of Michael Best & Friedrich have entered appearances for Epic Systems Corp. in a pending employment discrimination lawsuit. The suit was filed Sept. 7 in Wisconsin Western District Court by Levine Eisberner LLC and Siri & Glimstad on behalf of a project manager who claims that he was wrongfully terminated after applying for a religious exemption to the defendant's COVID-19 vaccine mandate. The case, assigned to U.S. Magistrate Judge Anita Marie Boor, is 3:24-cv-00630, Secker, Nathan v. Epic Systems Corporation.
Who Got The Work
David X. Sullivan, Thomas J. Finn and Gregory A. Hall from McCarter & English have entered appearances for Sunrun Installation Services in a pending civil rights lawsuit. The complaint was filed Sept. 4 in Connecticut District Court by attorney Robert M. Berke on behalf of former employee George Edward Steins, who was arrested and charged with employing an unregistered home improvement salesperson. The complaint alleges that had Sunrun informed the Connecticut Department of Consumer Protection that the plaintiff's employment had ended in 2017 and that he no longer held Sunrun's home improvement contractor license, he would not have been hit with charges, which were dismissed in May 2024. The case, assigned to U.S. District Judge Jeffrey A. Meyer, is 3:24-cv-01423, Steins v. Sunrun, Inc. et al.
Who Got The Work
Greenberg Traurig shareholder Joshua L. Raskin has entered an appearance for boohoo.com UK Ltd. in a pending patent infringement lawsuit. The suit, filed Sept. 3 in Texas Eastern District Court by Rozier Hardt McDonough on behalf of Alto Dynamics, asserts five patents related to an online shopping platform. The case, assigned to U.S. District Judge Rodney Gilstrap, is 2:24-cv-00719, Alto Dynamics, LLC v. boohoo.com UK Limited.
Featured Firms
Law Offices of Gary Martin Hays & Associates, P.C.
(470) 294-1674
Law Offices of Mark E. Salomone
(857) 444-6468
Smith & Hassler
(713) 739-1250


