VS Insights: Crash Test

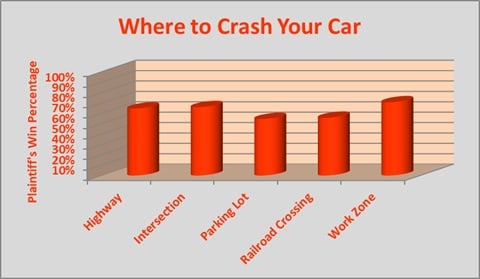
We’ve all heard the saying, “He or she was in the wrong place at the wrong time.” It’s usually used to explain an otherwise inexplicable accident. Is there such a thing as the right place at the wrong time? If you’re driving a car and involved in an accident, the right place is probably a work zone. Stay with us. Using the VerdictSearch database, we sampled motor-vehicle cases to see which places -- for example, work zones, intersections, parking lots -- provide the most favorable outcome for plaintiffs when an accident results in a lawsuit. Work zones are the easy winner, based on a 70.5 percent win rate for plaintiffs in such cases. Intersections and highways are next most favorable to plaintiffs, and railroad crossings and parking lots are least favorable to plaintiffs. The takeaway, as usual, is that research can often provide valuable insight regarding the strength of a case. To check another accident type, use the search platform on Law.com/VerdictSearch.
VS Insights: Nuclear Fallout

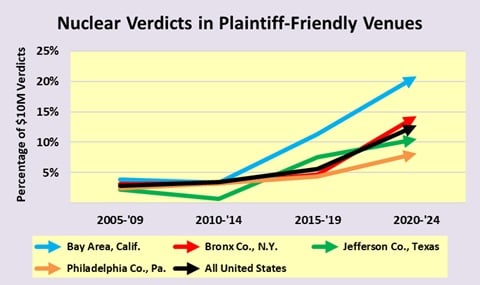
This issue’s trend study is a mash-up of two of our favorite topics: plaintiff-friendly venues and nuclear verdicts. Nuclear verdicts, that is, jury verdicts of at least $10 million, have been increasing in frequency steadily in the past 20 years, and sharply in the past 10. It seems reasonable that, if the typical jury has become more inclined to issue a monster verdict, a plaintiff-friendly jury would be even more generous with supersized verdicts. Well … yes and no. The accompanying chart, based on cases reported to VerdictSearch, depicts the frequency of nuclear verdicts since 2005. The black line is the baseline: It shows that nuclear verdicts are a staggering 350 percent more common since 2005! The other lines reflect results in four of the country’s most plaintiff-friendly venues: California’s Bay Area counties, Alameda and San Francisco, which are represented by the blue line; New York’s Bronx County, represented by the red line; Jefferson County, Texas, represented by the green line; and Philadelphia County, Pennsylvania, represented by the orange line. Somewhat surprisingly, the frequency of nuclear verdicts is below the nationwide rate in two of the plaintiff-friendly venues, Philadelphia and Jefferson Counties, though it is above the nationwide rate in the other two venues … with California's Bay Area counties being far above the nationwide rate. Just another reminder that venue bias is not always consistent. The takeaway: Research trends and see for yourself before making a decision about the value of your case.
VS Insights: Governmental Blues

The ongoing call for police reform will undoubtedly reverberate in the realm of civil litigation. Governmental entities will likely face taller hurdles when defending these cases, and it’s a good bet that settlements will become more common and more costly. But the reality is that police cases have been increasingly more troublesome for governmental entities for quite some time, as demonstrated by the accompanying chart, based on cases reported to VerdictSearch. The chart tracks almost 20 years of recoveries in cases involving governmental defendants. The blue bars represent median recoveries in police cases. The darker blue bar reflects jury verdicts, and the lighter blue bar reflects settlements. Note the sharp increase in recoveries in the past 10 years, particularly for jury verdicts. For perspective, the chart also depicts the recovery trend for governmental cases involving falls. The red bar reflects jury verdicts, and the pink bar reflects settlements. Recoveries have increased here too -- as they have in most areas of civil litigation -- but not nearly as dramatically as the police cases have. So while governmental defendants are indeed feeling the effects of social inflation, the impact is greatest when the governmental defendant is a law-enforcement officer. To check the trend in your area, use the research platform on Law.com/VerdictSearch.
VS Insights: A Product of the Times

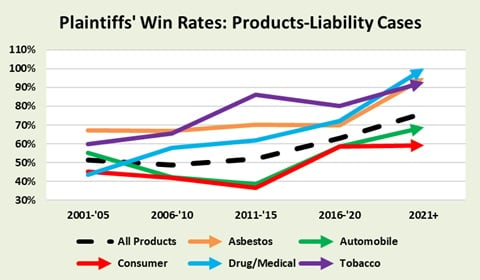
The increasing frequency of so-called “nuclear verdicts” has spared virtually no area of civil litigation, though it’s difficult not to notice the huge awards juries have been issuing against manufacturers of products such as cigarettes, medical devices, pharmaceuticals and talc. If you haven’t noticed, just turn on your television after 1 a.m. and you’ll surely see a commercial that delivers the message. For this issue’s trend study, we thought we’d see whether juries are judging liability in these cases any differently these days. In other words, damages aside, are juries more inclined to rule for or against product makers than in the past? The accompanying chart, based on cases reported to VerdictSearch, depicts result trends in various types of product-liability cases since the turn of the century. The black dotted line represents all product-liability cases and shows that plaintiffs are winning significantly more often now than at the beginning of the century; 48.2 percent more often, to be precise. The other lines break out the results across different areas of the product-liability spectrum. Most notable are the purple, orange and blue lines, which represent tobacco, asbestos, and drug or medical device cases, respectively. These cases are almost entirely responsible for the 48.2 percent increase, whereas results in other types of product-liability cases aren’t drastically different from where they were over 20 years ago. To check another area of litigation, use the research platform at Law.com/VerdictSearch.

